
Turn Intent
Into Revenue
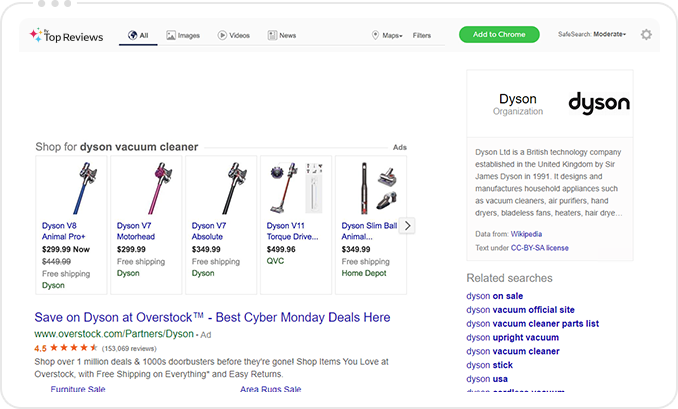
Leverage search, ads, shopping, and news
to monetize intent on your website, extension,
app, or any other digital property.
Generate More Revenue. Deliver Premium Results
App Monetization
Use search to monetize and
enhance user experience
on desktop and mobile apps


Search Mediation
For Media Traders who
wish to monetize search demand
to get higher yield
Website Monetization
Enrich your website with
shopping offers, news, and
text ads to earn higher revenues


The Proof Is In The Numbers
9,000,000,000
Searches annually, with an average of 25M searches daily
1.1K
Publishers
150
Countries, for global coverage in a variety of categories
20
Years of search technology
expertise at your service
9B
Searches annually, with an average of 25M searches daily
1.1K
Publishers
150
Countries, for global coverage in a variety of categories
20
Years of search technology
expertise at your service